OECD Financial Assistance Allocation within the Political Landscape of Uganda
| 1901 wordsAbstract:
This project examines the relationship between Official Development Assistance (ODA) allocation and important political leaders’ birth regions in Uganda. The scope of this research includes OECD reported project level assistance to the various regions within Uganda. The research methodology used for this project focuses on collecting data from geo-coded data, which was analyzed using pre-defined precision codes to break down information into observable trends at the district level. This project displays data in map and table format to reach statistically significant and empirically sound results. Using a series of dummy variables and district population, the results of this project concludes that birth regions of political leaders do not receive proportionally more assistance than other districts in the nation.
Key words: Foreign aid, Favoritism, Aid allocation, Uganda, Georeferenced data
1. Research Topic
Extensive research conducted has determined that home regions of political leaders receive preferential treatment (Barkan and Chege 1989; Moser 2008; Horowitz and Palaniswamy 2010; Burgess et al. 2011; Green 2011; Do et al. 2013). So, where are the 1.4 billion dollars of Official Development Assistance (ODA) being distributed within Uganda?
If analyzing the normative aspect of ODA distribution, it should be disbursed evenly to areas that exhibit the greatest pressure for need without preferential treatment. However, a working paper published by AidData shows a strong correlation between the leader’s birth region and aid programs established within the entire African continent (Dreher et al.).
This project examines Organization for Economic Co-operation and Development (OECD) assistance projects within the country of Uganda in an attempt to support Dreher’s factual findings. Uganda, as a nation within the African continent, should by de facto exhibit preferential ODA distribution to the leader’s home region. Specifically, does President Museveni leverage his political power to have an effect on the amount of ODA allocation for his home region (Ntungamo)? This project hypothesizes that Ntungamo will receive proportionately more ODA than other districts.
2. Theoretical Basis
Several recent papers have been published about ODA allocation and the possibility of financial favoritism among regions. Dreher et al.’s paper “Aid on Demand: African Leaders and the Geography of China’s Foreign Assistance” focuses on the relationship between Chinese aid inflow to Africa and the recipient locations. As outlined by the State Council, “[w]hen providing foreign assistance, China adheres to the principles of not imposing any political conditions, not interfering in the internal affairs of the recipient countries and fully respecting their right to independently choose their own paths and models of development.” Dreher et al. concluded that the region from which political leaders are born has a significant positive correlation. The Corruption Perceptions Index published by Transparency International ranks Uganda as 142 out of 174, strongly implying a corrupt political structure within the nation. This index strongly suggests that Uganda will comply to Dreher et al.’s model of financial favoritism. This project hones in on the nation of Uganda by analyzing foreign assistance programs from all OECD donor countries. Previous methods to analyze foreign African aid interpret aid data as a ratio of one source to numerous recipients while this project interprets aid data from numerous sources to one country. The one-to-many theory postulates that aid distribution is directly correlated to biased regions, and this project extrapolates that theoretical method of aid distribution to the many-to-one aid distribution.
3. Methodology
Using the very recent release of Ugandan ODA dataset from the AidData organization, a variety of filter methods were used to correct a major statistical anomaly. Each disbursement recorded is geocoded and assigned within a project; however, the disbursement amount for each district is the sum of the project disbursements. The same assumption of other economists was implemented to spread ODA amounts evenly (Dreher et al.). Then, the assistance programs included within the data set that correspond to country and to regional level programs were too broad to be considered and omitted from the analysis. Instead, this undertaking focuses on district level projects. Using a filter, each project aligned to a district with the sum of the averaged totals calculated for each respective district. These calculated totals represent the sum of disbursements from 1984-2010, which corresponds to both the year Museveni took office and the first year of recorded funds sent to Uganda. The population statistics from the 2002 census by the Ugandan Bureau of Statistics corrected for the most recent change for district units. The time that the census was conducted was when Uganda had 56 districts. During the 2002 census, the World Resources Institute was able to gather rural poverty data, which is heavily featured in the created map in this report.
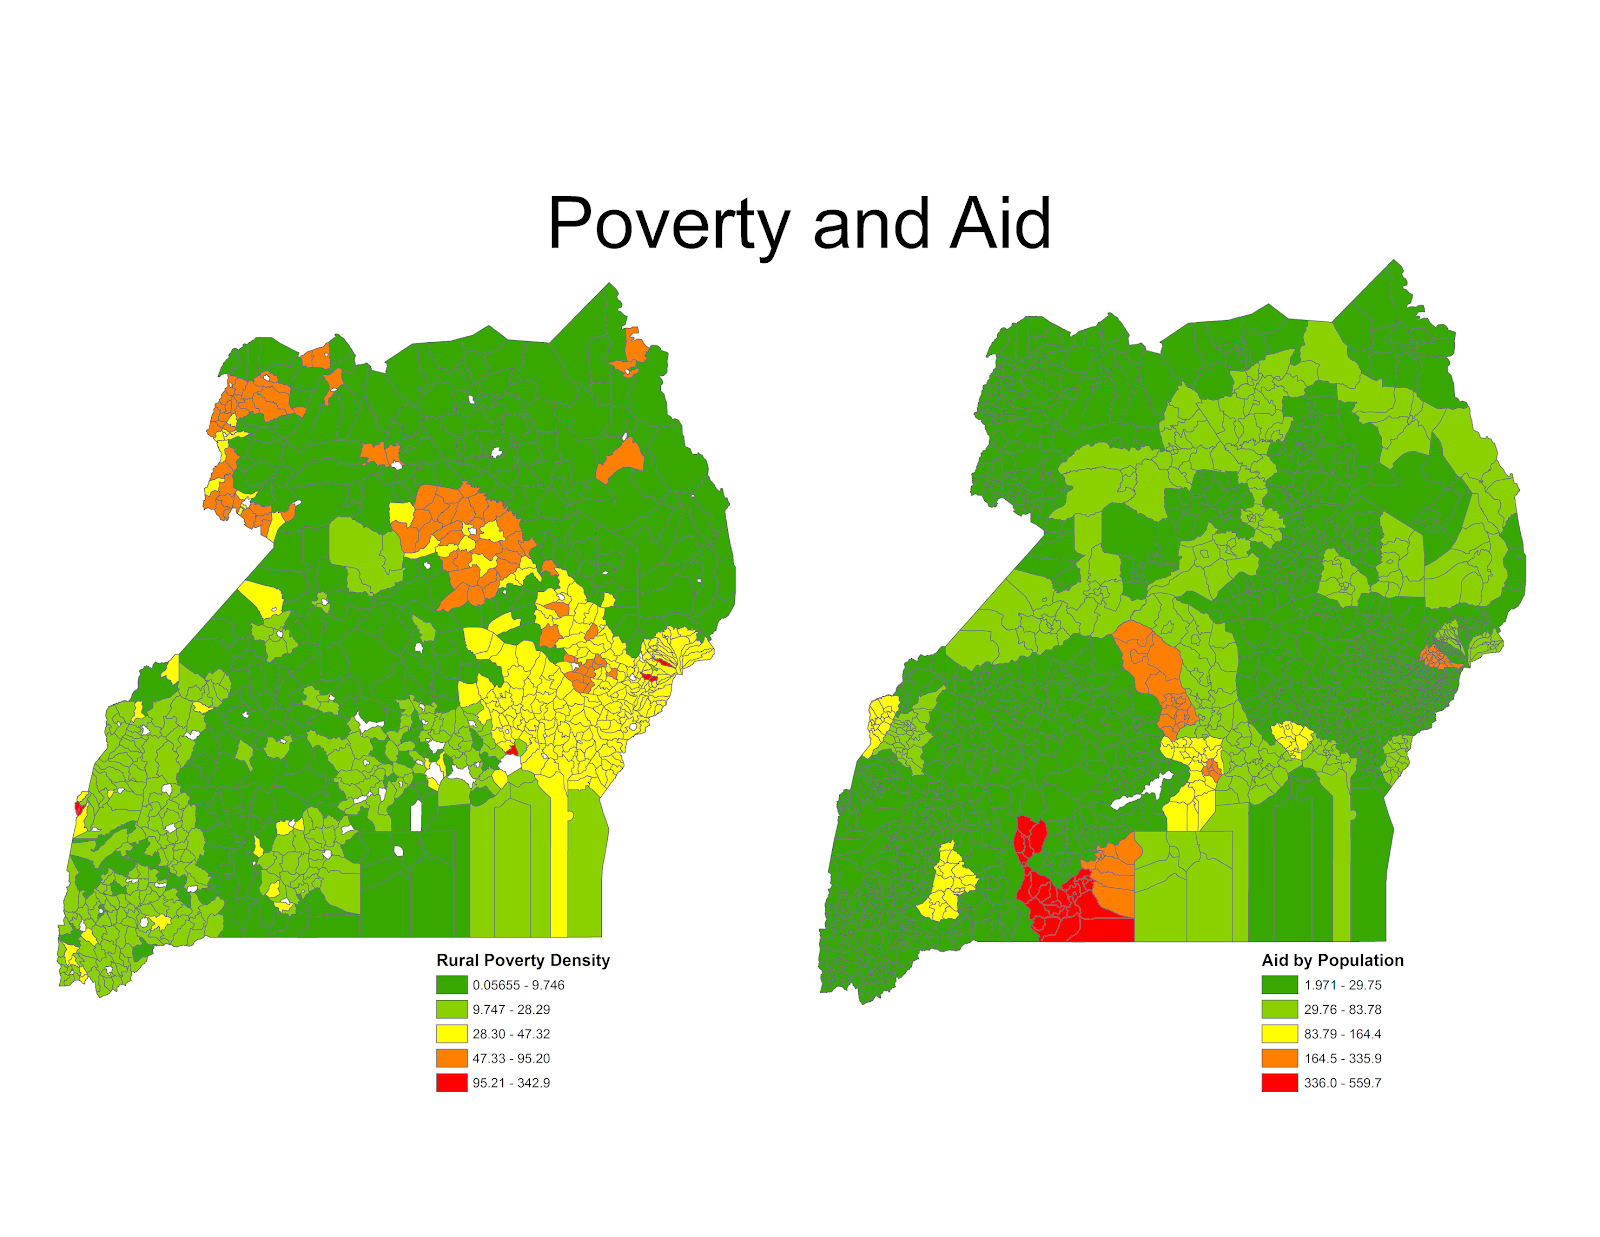
_The map on the left uses World Resources Institute data to show the number in poverty per kilometer squared. The map on the right shows the sum of Official Development Assistance in US dollars from 1984 to 2010 per population.()
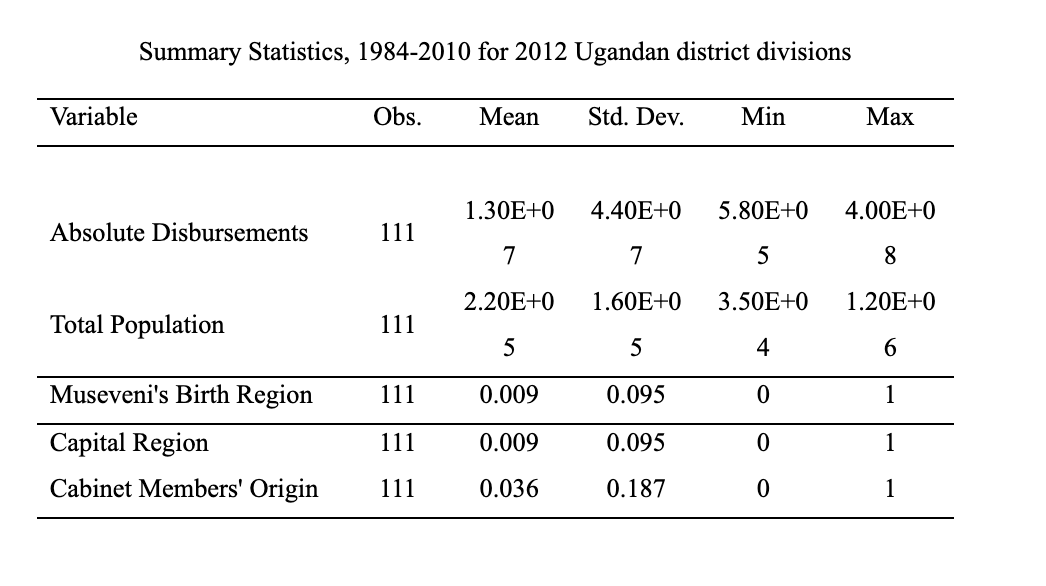
Dreher et al.’s model, which was applied in this project, uses a logarithmic transformation for both district level ODA and total population. Furthermore, a series of binary variables were applied for birth regions of Museveni and for other major political leaders. Important leaders include the Vice President Edward Ssekandi of the Masaka District, the Prime Minister Ruhakana Rugand of the Kabale District, the Speaker for Parliament Rebecca A. Kadaga of the Kamuli district and the Minister for Security Mary K. Okurut of the Bushenyi district. The First Deputy Prime Minister does not have reported district level origin. The Second and Third Deputy Prime Minister’s are respectively retired and vacant thus were also unable to analyzed. The capital district, Kampala, was included as a separate binary variable to analyze fund allocation.
4. Results
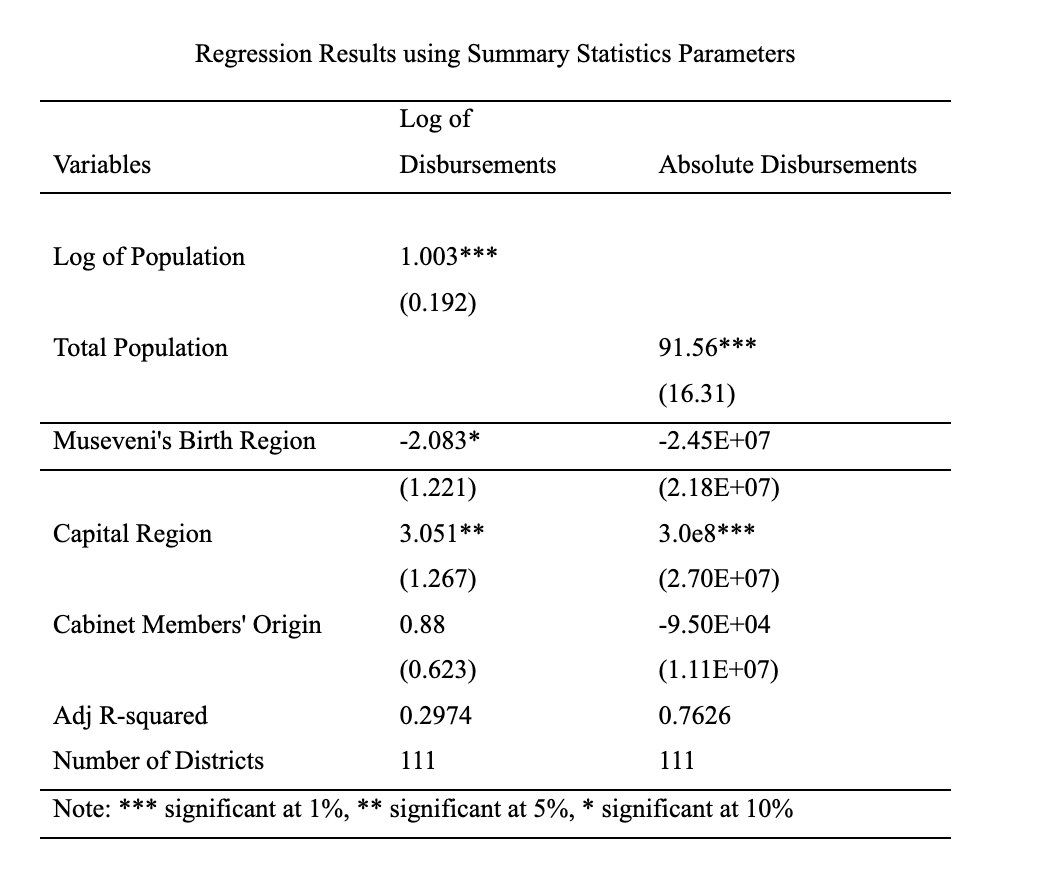
From the regression analysis in Table 2, one can reasonably conclude that log of population and the capital region have a positive effect for district level assistance; however, the regression yields a statistically significant result for the president’s home region receiving less of the ODA available. Although the logarithmic transformation yields a lower R-squared, it shows proportional additional assistance for every 1% increase in population of a district correlates with a 1.003% in assistance. Whereas Dreher et al. concludes that Chinese aid is demand driven, Aid Data pulls from all donors thus creating a supply driven assistance. Therefore, the supply of assistance depends on mutual interest with more weight on donor’s needs than recipients’ needs. Using the log of disbursements model, the presidents birth region receives 2.1% less assistance than other districts in the country. The ODA map has one red codified district because the population is proportionally low and overall project level assistance is in close proximity of the mean level of ODA disbursements. Therefore, the Rakai district receives more ODA per capita but not in the absolute sense.
5. Conclusion
This research proves that district level assistance is not politically determined. Additionally, project level assistance is not allocated to the most impoverished areas. The conclusions deduced within this paper have a number of limitations. Namely, the majority of the data analyzed was collected by the Ugandan Bureau of Statistics that may or may not report accurate measures of poverty. If the perceived level of corruption is any indicator for reliable officials, it is reasonable to assume some biased reporting to maintain the United Nations development goals. Second, only project level ODA was analyzed within this undertaking with programs that are regional and are to the entire country for a predefined goal by the donor country was purposefully omitted. However, these programs cannot be accurately tracked given the data set and require further analysis to ensure favoritism does not spill into the altruistic incentives placed by donor countries. Third, the results concluded in this research are from the summed amounts given within the data and do not include the Consumer Price Index to appropriately adjust for inflation. Fourth, Uganda has divided its districts into smaller and smaller portions often splitting unevenly.
Policy Implications:
This project focuses on district level inflows of finance and severs a large portion of information for larger programs of financing. Although Museveni’s and other political members’ birth regions seem to not receive proportionally more ODA, more research should be conducted for program level allocation. At this time, no policy implications should be applied to the district level of Ugandan ODA.
Future research:
There are many avenues to build on the information and insight collected in this project. The most directly translatable project would examine aid distribution during political elections to determine if an influx of aid is given to swing districts. Even though Uganda has high corruption levels, the conclusion reached in this research would suggest that aid allocation is not politically biased.
Another opportunity for future research on this topic would solve for the gaps in poverty density reports. Future research can examine visible and infrared light data to capture a level of development not reported by countries since light density is strongly correlated with GDP per capita (Henderson et al. 2012; Hodler and Raschky 2014a).
While the research conducted here disproves Dreher et al.’s theory, that theory is an aggregate of all African nations’ data. An interesting potential extension of this project would examine the influence of ODA on district allocation for each African nation. This future research would tie back and determine if Uganda is an anomaly or with a strong minority.
References
Barkan, Joel D. and Michael Chege. 1989. Decentralising the State: District Focus and the Politics of Reallocation in Kenya. Journal of Modern African Studies 27, 3: 431-453.
Burgess, Robin, Remi Jedwab, Edward Miguel, Ameet Morjaria, and Gerard Padro i Miquel. 2011. Ethnic Favoritism. Working Paper. Accessed at https://www.dartmouth.edu/∼neudc2012/docs/paper 230.pdf.
Do, Quoc-Anh, Kieu-Trang Nguyen, and Anh N. Tran. 2013. One Mandarin Benefits the Whole Clan: Home-town Favoritism in an Authoritarian Regime. Paper presented at the 2014 Annual Congress of the European Economic Association in Toulouse. http://www.eea-esem.com/files/papers/EEA-ESEM/2014/2185/Mandarin%20Oct%2030%202013.pdf.
Dreher, Axel, Andreas Fuchs, Roland Hodler, Bradley C. Parks, Paul A. Raschky, and Michael J. Tierney. 2014. Aid on Demand: African Leaders and the Geography of China’s Foreign Assistance. AidData Working Paper #3. Williamsburg, VA: AidData.
Green, Elliott. 2011. Patronage as Institutional Choice: Evidence from Rwanda and Uganda. Comparative Politics 43, 4 : 421-438.
Henderson, Vernon J., Adam Storeygard, and David N. Weil. 2012. Measuring Economic Growth from Outer Space. American Economic Review 102, 2: 994-1028.
Hodler, Roland, and Paul A. Raschky. 2014b. Economic Shocks and Civil Conflict at the Regional Level. Economics Letters 124, 3: 530-533.
Horowitz, Leah, and Nethra Palaniswamy. 2010. In Pursuit of Votes: The Capture of the Allocation of Local Public Goods by the Central State in Ghana. IFPRI Discussion Paper.
Moser, Christine. 2008. Poverty Reduction, Patronage or Vote Buying? The Allocation of Public Goods and the 2001 Election in Madagascar. Economic Development and Cultural Change 57, 1: 137-162
State Council of the People’s Republic of China. 2014. Full Text: China’s Foreign Aid. Accessed on 01 November 2014 at http://news.xinhuanet.com/english/china/2014-07/10/c 133474011.htm
Strandow, Daniel, Michael Findley, Daniel Nielson, and Joshua Powell. 2011. The UCDP-AidData codebook on Geo-referencing Foreign Aid. Version 1.1. Uppsala Conflict Data Program. Uppsala, Sweden: Uppsala University.
Transparency International. Annual Corruption Perception Index 2014. Uganda Bureau of Statistics. 2013. Statistical Abstract corrected from the 2002 census.
World Bank. 2014. World Development Indicators. Washington, D.C.
World Resources Institute. Geocoded Poverty Data for 2005 Rural Subcounties.